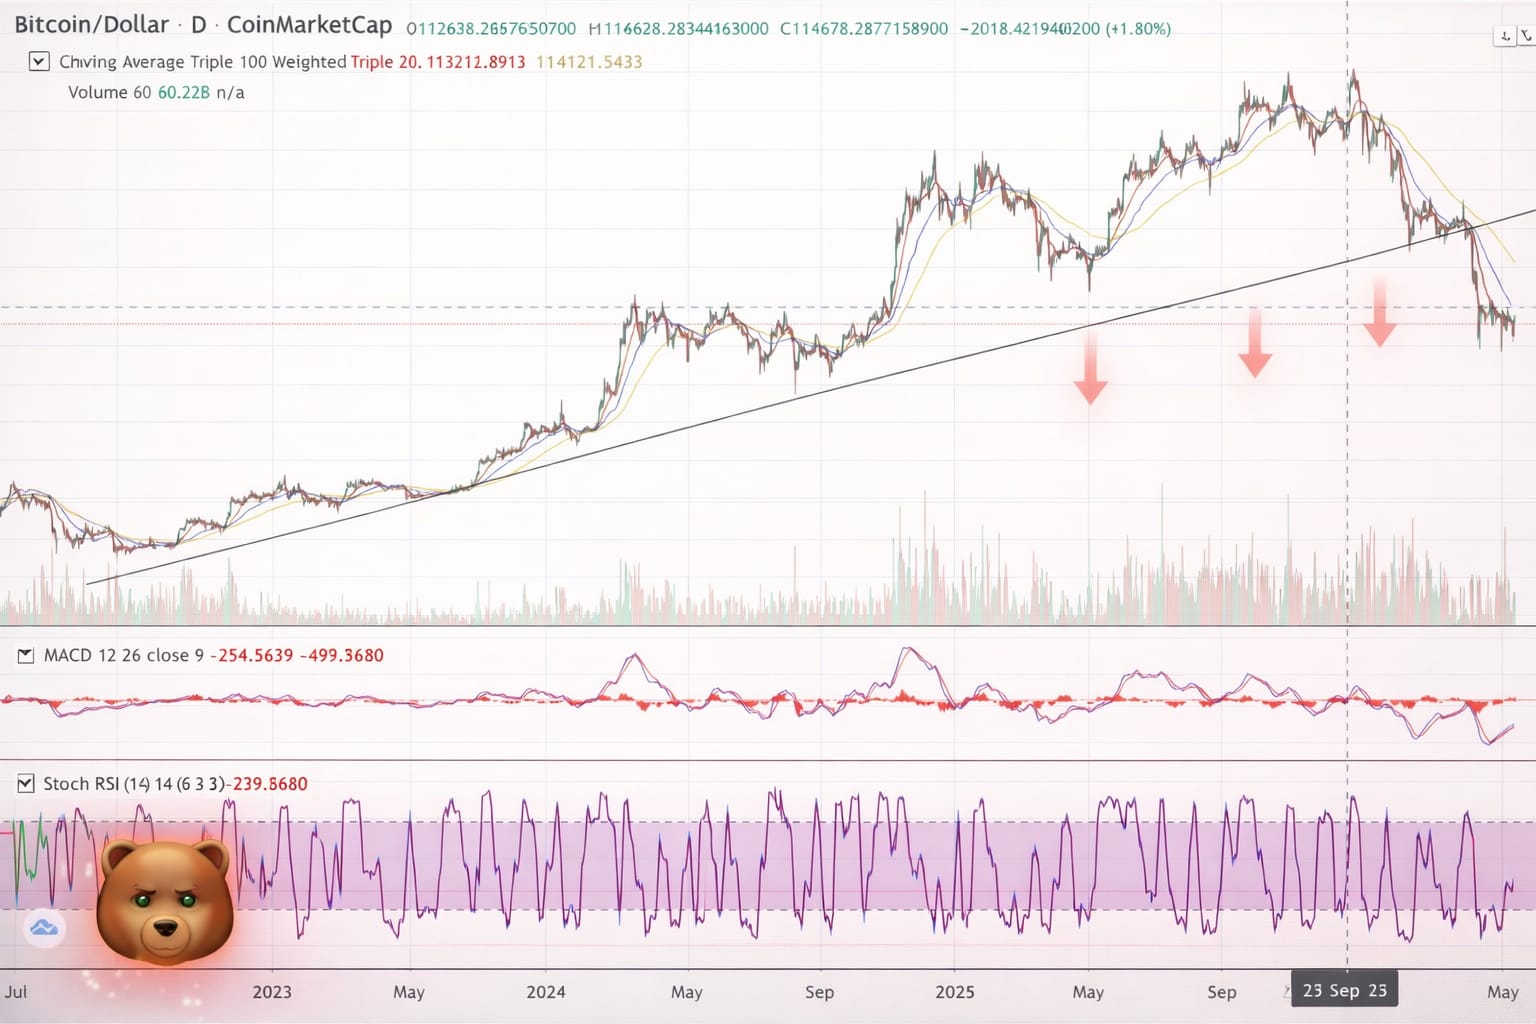
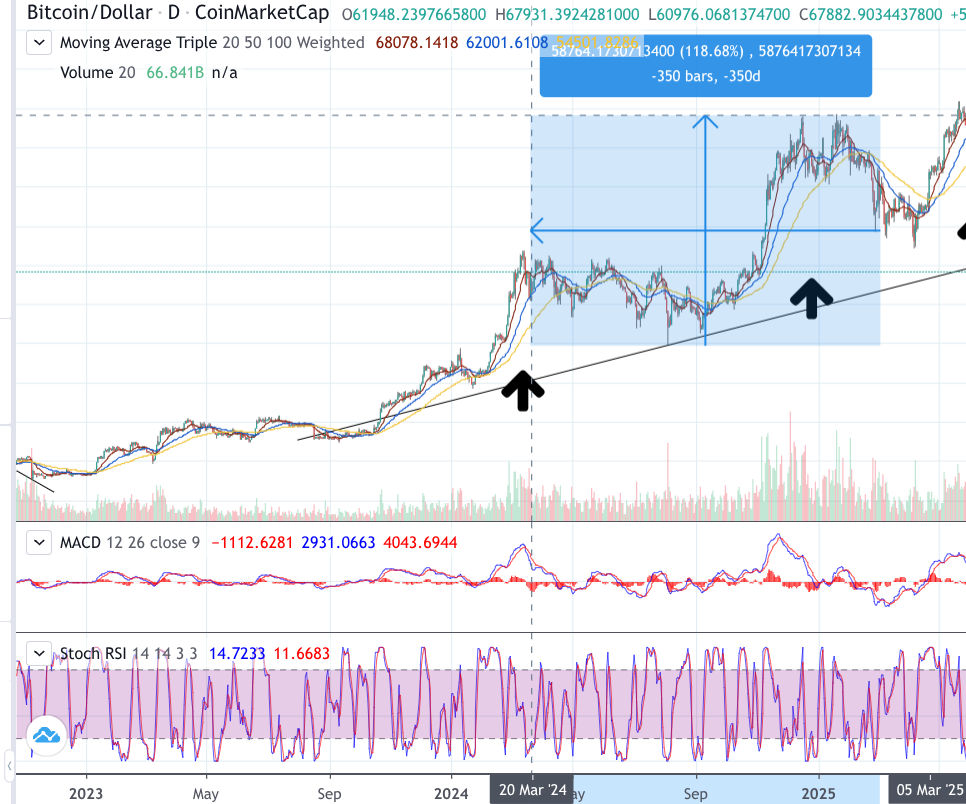
Bitcoin has been in a downtrend since October. I see a lot of posts saying Bitcoin is heading to 30k or that the bottom is in. But let’s closely monitor the scenarios.
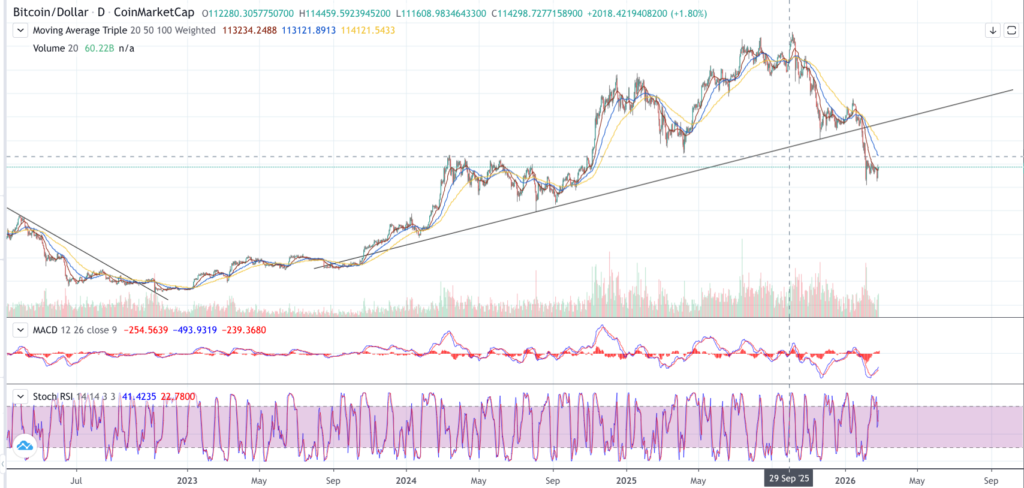
I decided to take profits at 100k on Bitcoin. The key signal was the break of the multiyear trendline, and several momentum and structure signals also turned bearish, including weakening momentum on rallies. The macro situation also showed potential risks in the market. Since October, the market has been pricing in the risk of liquidity stress as QT continues draining capital from the system.

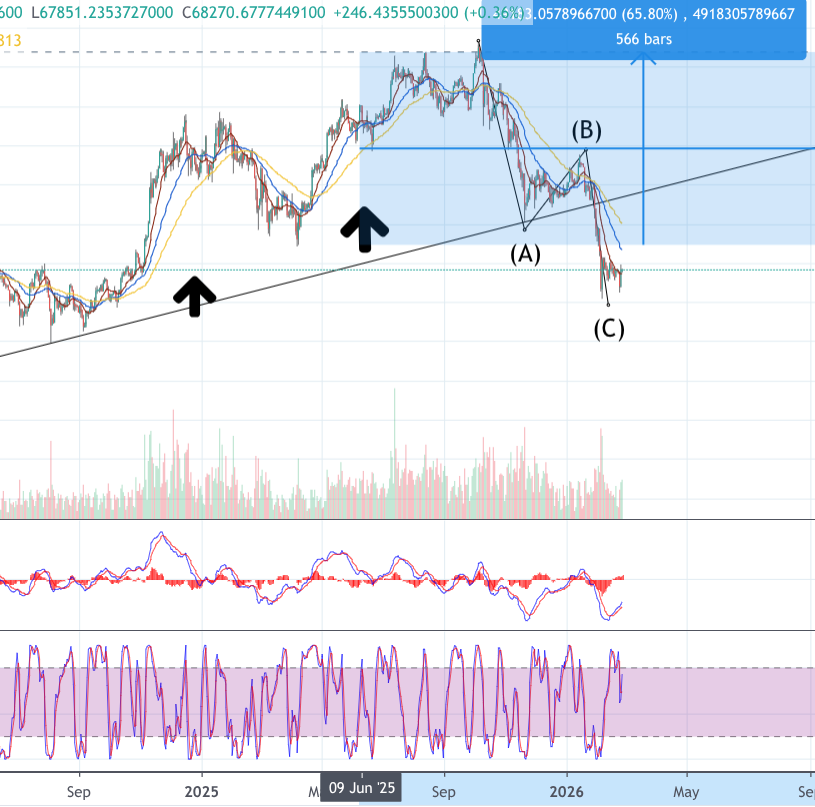
As I have explained in my articles touching on Bitcoin volatility, profit-taking by large players combined with the structure of the market has caused major liquidations in recent months. You can clearly see an A-B-C pattern in the current correction, where the A and C waves are strong impulsive moves down. Corrections that include two strong impulsive legs down often indicate that the market is still working through excess leverage. This is usually a sign that the bottom may be closer than many expect.
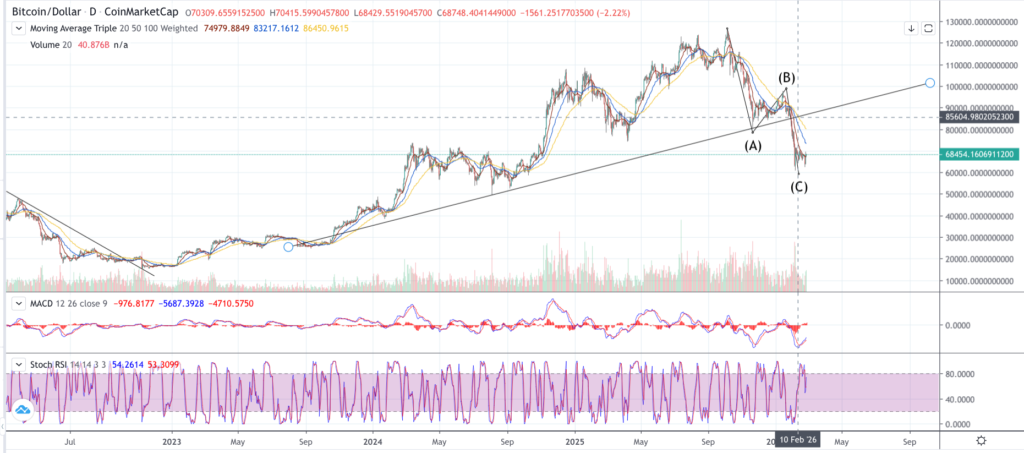
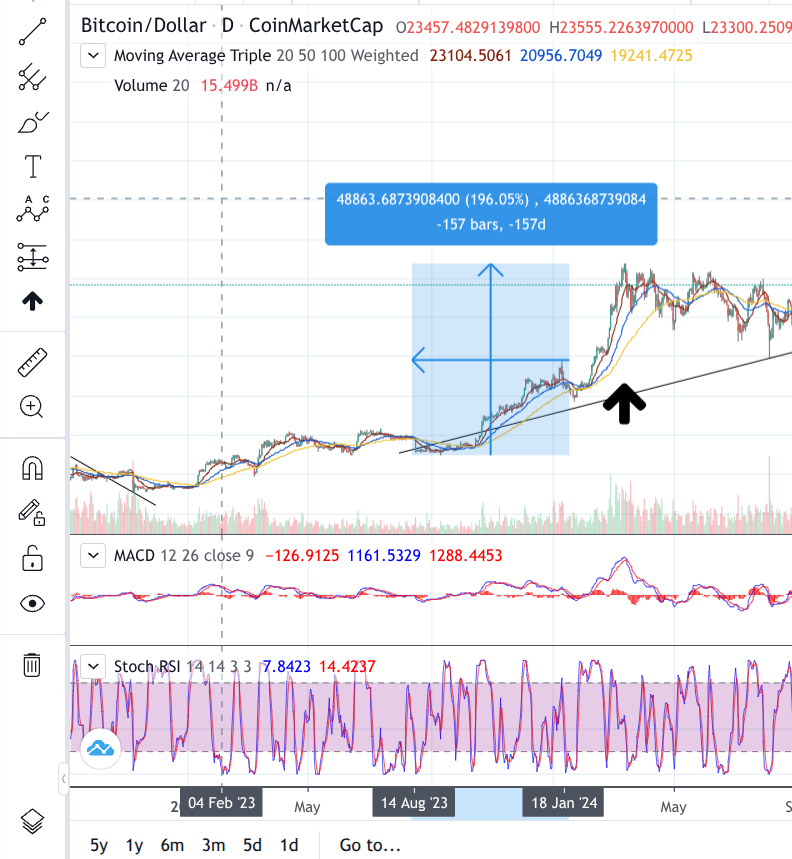
As you can see in the A-wave, a strong impulse into the uptrend is usually a very bearish sign. It does not always lead to a breakdown, but it increases the probability of continued downside rather than an immediate move higher — especially since the impulsive moves up since 2024 have become weaker each time.
Based on the data we have, Bitcoin is still, in my opinion, looking for one final liquidation move lower. We have not yet seen the kind of market stress that typically forms around major bottoms.
Bottoms usually form when liquidity is fully drained and forced selling dominates. It rarely happens quietly — there is usually a strong narrative or event attached to it. In 2020 it was COVID. In 2022 it was the FTX collapse. In April 2025 it was the tariff war.
At those moments, positioning becomes extremely one-sided, leverage gets flushed, and volatility spikes aggressively. That is typically when markets reset.
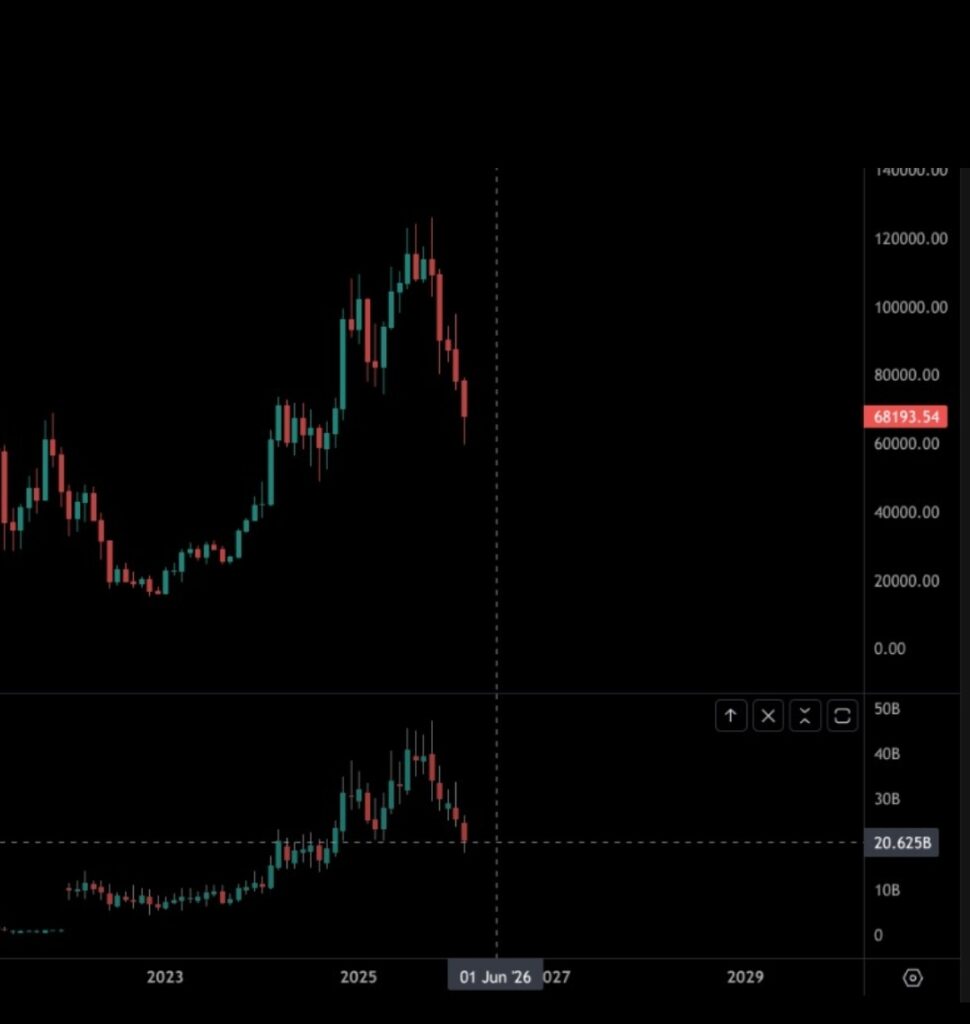
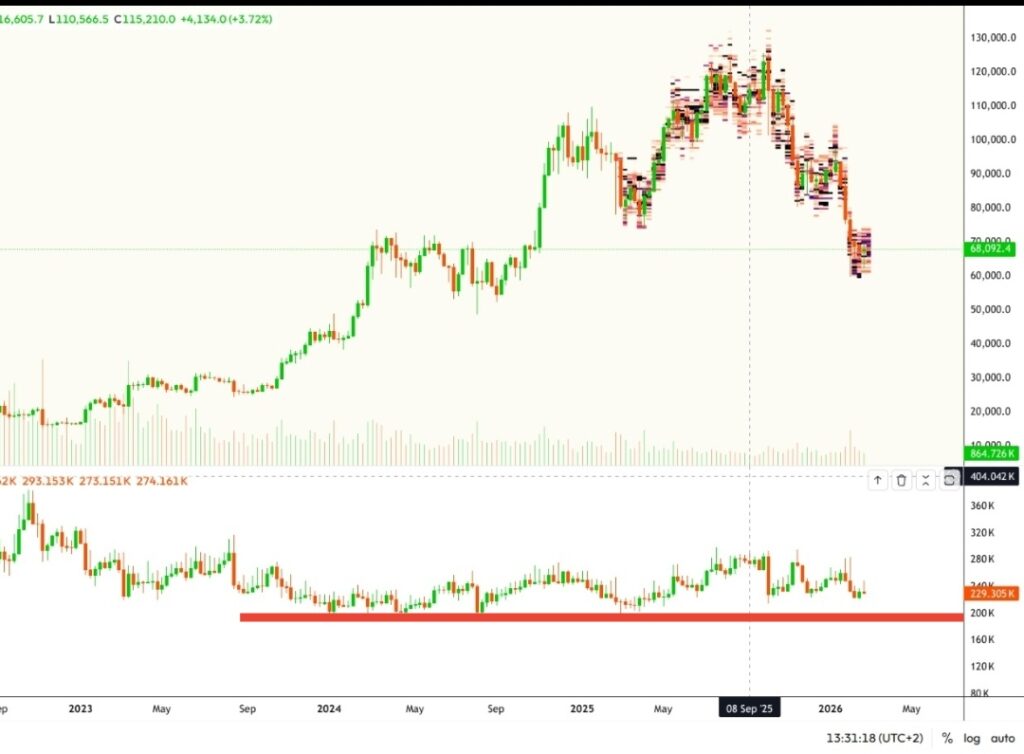
If we now look at liquidity conditions in Bitcoin, there still appears to be room for further downside. Positioning is not yet at extremes, and we have not seen the type of panic-driven capitulation that often marks cycle lows.
From a macro perspective, the Fed has not restarted QE or begun injecting liquidity back into the system — something that has historically been important for sustained crypto bull runs. Without expanding liquidity, upside moves tend to struggle to gain long-term momentum. Altcoins have suffered significantly in recent years due to the lack of liquidity in the system.
What next?
Based on how the data looks right now, I see two most likely scenarios.
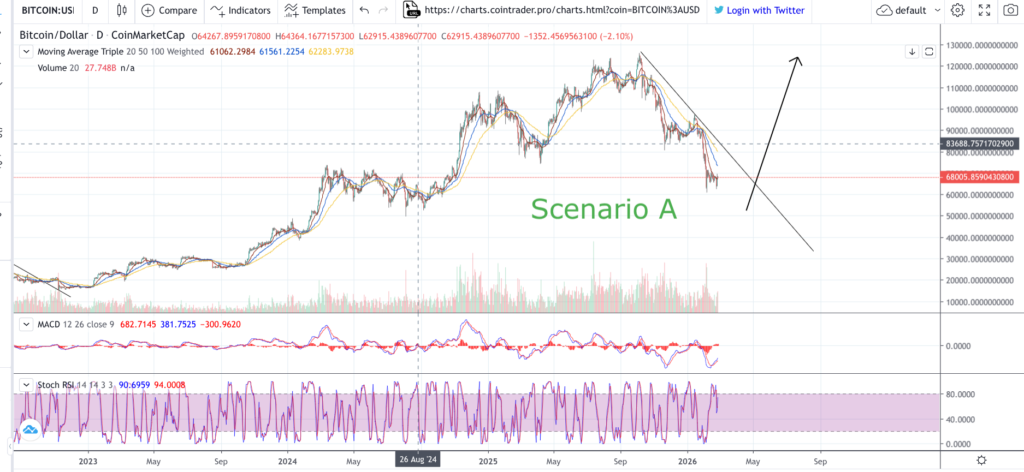
Scenario A is the more bullish one, where we are close to ending the post-QT correction. In this case, Bitcoin moves back toward the 80–100k range, consolidates for a while, and then pushes to new all-time highs.
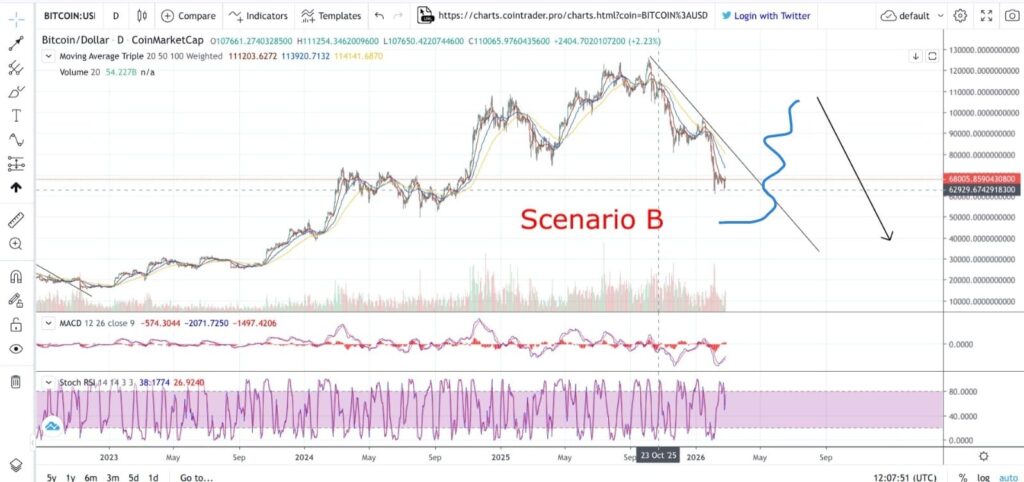
Scenario B is that Bitcoin rallies toward the 80–100k area but fails to hold strength. From there, it forms a lower high and corrects back toward new lows. The key will be how price behaves around the 80–100k region.
In both scenarios, however, we are likely approaching a zone where the market could see at least a temporary move higher. Even within a broader correction, counter-trend rallies can be strong and tradable.
Now it’s good to remember that this is not about predicting the market with 100% accuracy. It’s about positioning based on the data available and adjusting as new information comes in. If price confirms strength, bias can shift. If it confirms weakness, risk can be reduced.
The goal is not to guess the next move — it’s to react to what the market shows.
Liquidity and macro conditions will ultimately determine the larger direction.
This is not investment advice, just my personal view based on years of experience in high-risk markets.
— MastertheEdge