There hasn’t been much change in Bitcoin price behavior. We’re still ranging between roughly $60,000 support and $80,000 resistance.
Instead of trying to call the exact bottom or catch the next big move, it makes more sense to focus on how to actually build a position in a high-probability area. That’s where most people mess up.
Funding rate, Long/Short ratio and Open Interest
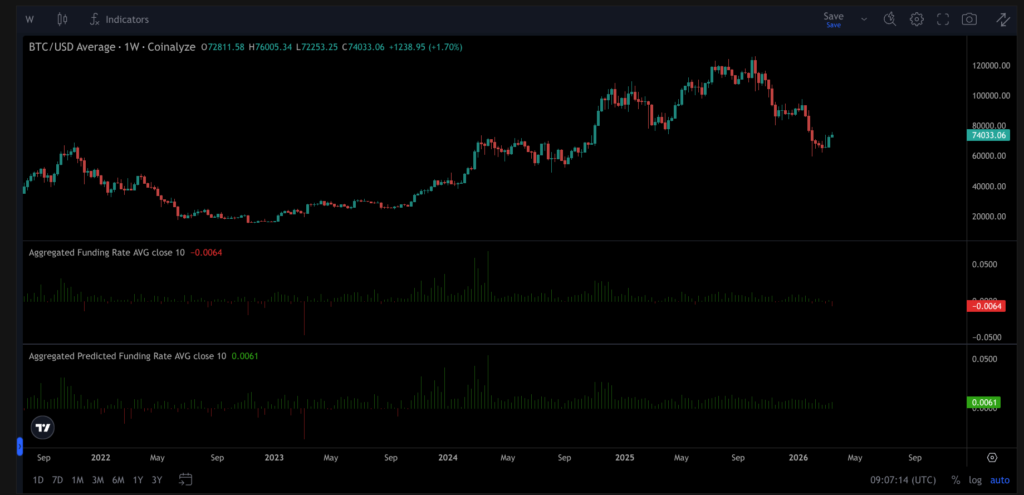
Let’s start with the funding rate.
Funding is negative while price is holding relatively strong. That’s usually a good sign.
What you typically see near bottoms is simple:
People are positioned bearish, sentiment is bad but price just doesn’t move lower. We’re getting close to that type of environment.
That being said, most of the time the market still needs one more proper flush. Something that pushes funding clearly into extreme negative while price stabilizes. That’s what we saw in 2022 as well.
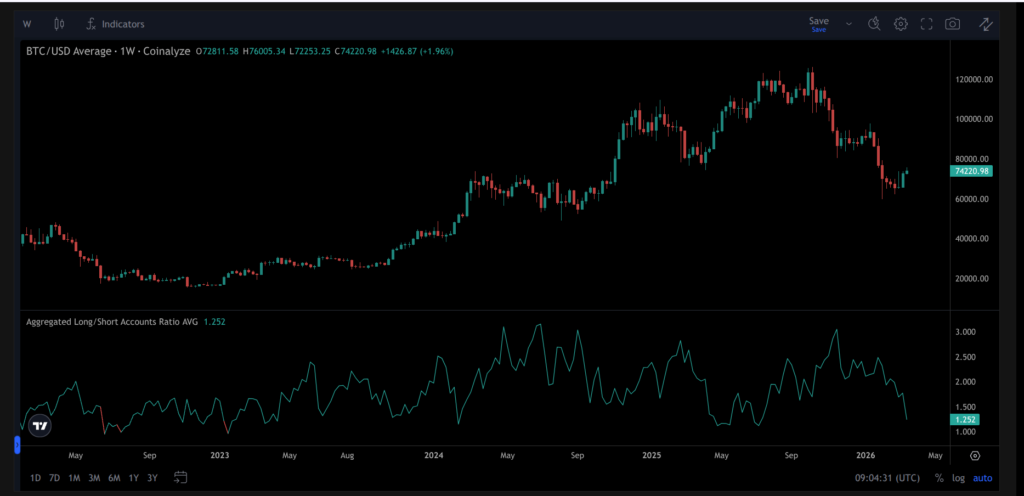
Looking at the long/short ratio:
We’re moving closer to 50/50. That’s again something you usually see when a bottom is forming.
In bull markets this doesn’t really happen. But during resets and bear phases, this often moves below 1 (more shorts than longs). We’re not fully there yet, but directionally it makes sense.
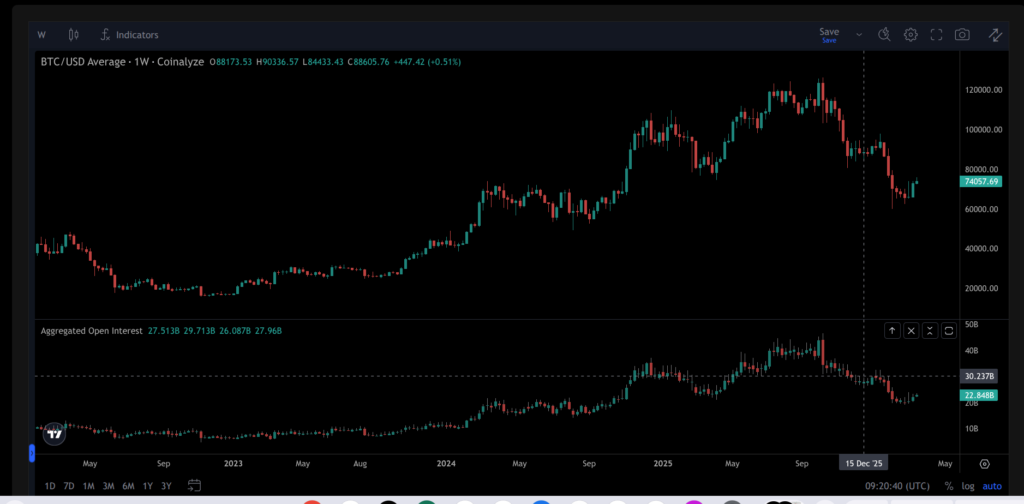
Now Open Interest.
There’s still some room for OI to come down, but not much.
As mentioned in previous updates, the move from 2022 to 2024 was mostly driven by spot buying, not by aggressive leverage. That makes a full move back into that range less likely, but not impossible.
What matters here is the structure of positioning. In 2024, that area was filled mostly with longs. The market was building higher with long exposure behind it. If price now moves back closer to those same levels, the structure would likely be very different. Instead of being full of longs, that zone would more likely be filled with shorts. That matters, because the same price level does not always mean the same market structure.
A reset where OI comes lower and positioning flips from long-heavy to short-heavy would actually clean the market a lot. That kind of setup often creates a much better foundation for the next bigger move.
How does the chart price chart show and how to act now?
If you combine all of this with the chart, you get a pretty clear picture.
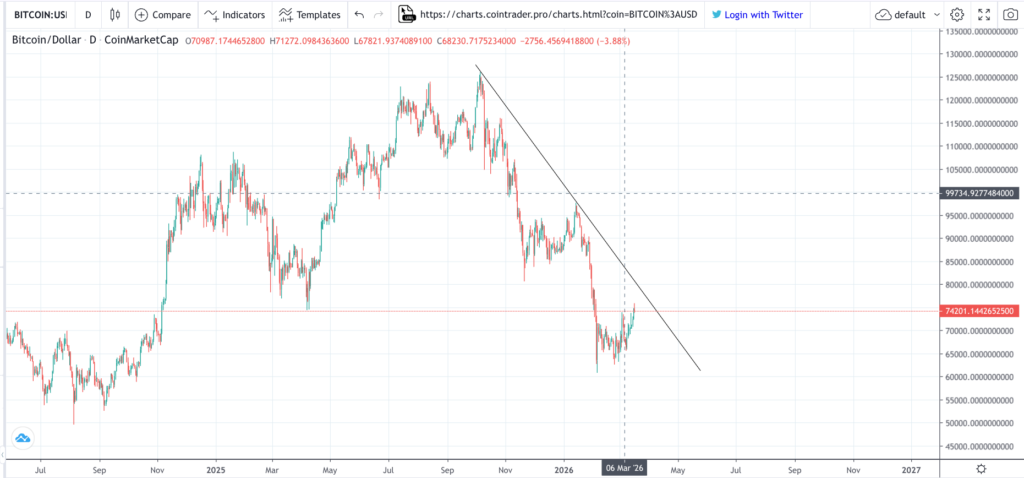
We’re still in a downtrend and trading below a multi-month trendline. These are not magic, but they give structure. The more times price tests it, the more likely it eventually breaks. But until that happens, it’s still resistance.
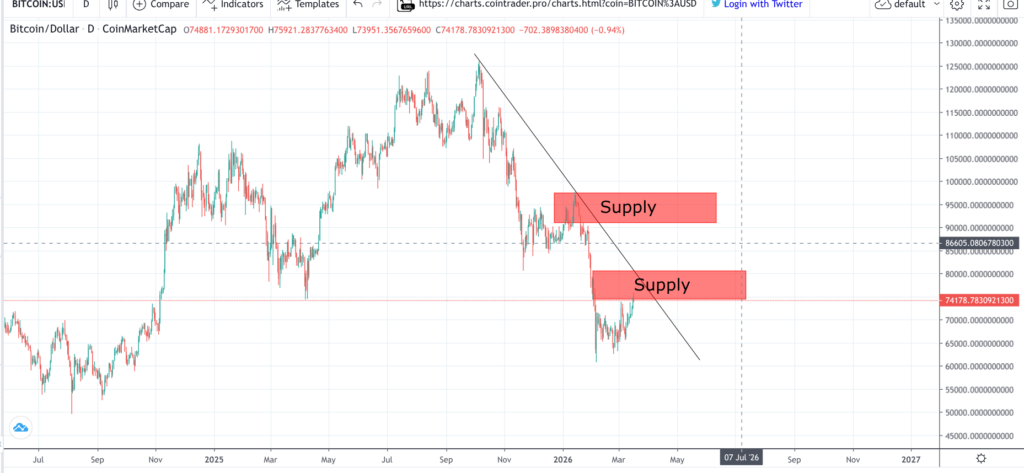
Above current price there are clear supply zones.
And right now price is already struggling with the first one.
That’s usually not what you want to see if you’re expecting immediate upside.
More likely scenario:
- Rejection from supply
- Move lower
- Then build a base
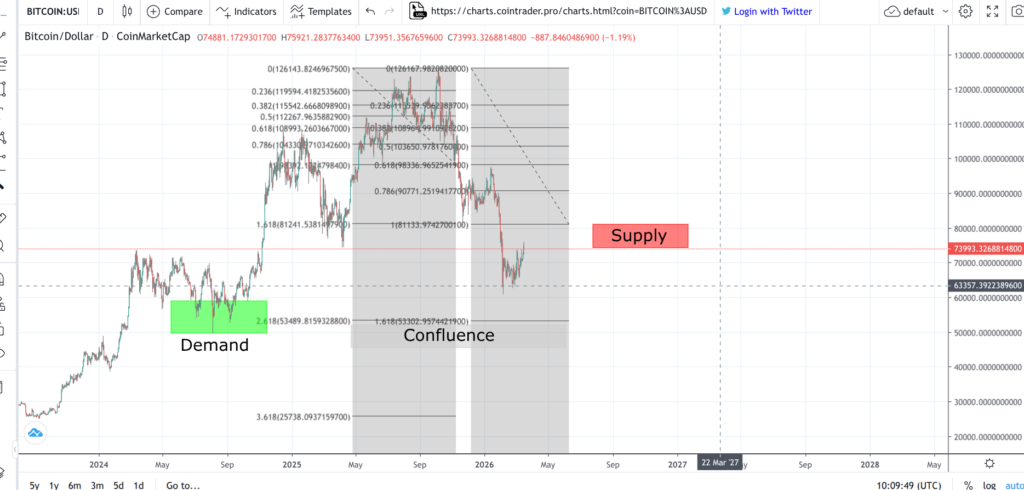
On the downside, the most interesting area is around $50k–$55k.
Why that area?
- Strong demand from 2024 accumulation
- Fib confluence
- Fits well with a liquidity reset
This is where things start to line up.
What will be the perfect entry?
There is no perfect entry.
But there is a smart way to do it.
The biggest mistake people make is going too big, too early. Better way:
- Identify key levels
- Scale in
- Keep cash on the side
For example:
Detect the major long-term support zones and deploy 1/3 of your free cash allocation at each level. If price goes lower, you still have capital left. If one of the levels holds, you already have exposure.
Simple, but most people don’t do it.
Market doesn’t reward being right once.
It rewards staying in the game long enough.
So instead of trying to be perfect:
- Avoid chasing
- Focus on key areas
- Manage your entry size
That’s it.
This is not investment advice – only my interpretation of the current data and market structure.
– MastertheEdge