
During the past weekend, markets reacted to escalating tensions in the Middle East. In last week’s update, I discussed how major bottoms are often formed around extreme narratives. Bad news tends to peak when positioning is already stretched.
Sometimes these events trigger the final leg down. Sometimes they mark the turning point. The key question is: which one is this?
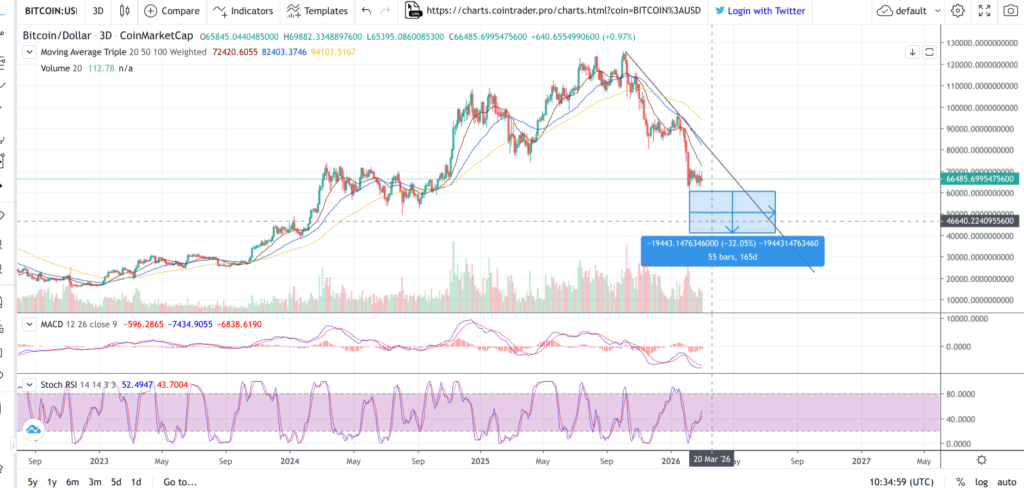
Market is still looking bearish
Bitcoin remains in a range between $60,000 and $80,000. In trending markets, Bitcoin often retests range lows or prior breakdown levels before continuing the move. Until structure shifts, lower highs and lower lows remain the dominant pattern. That keeps short-term momentum bearish.
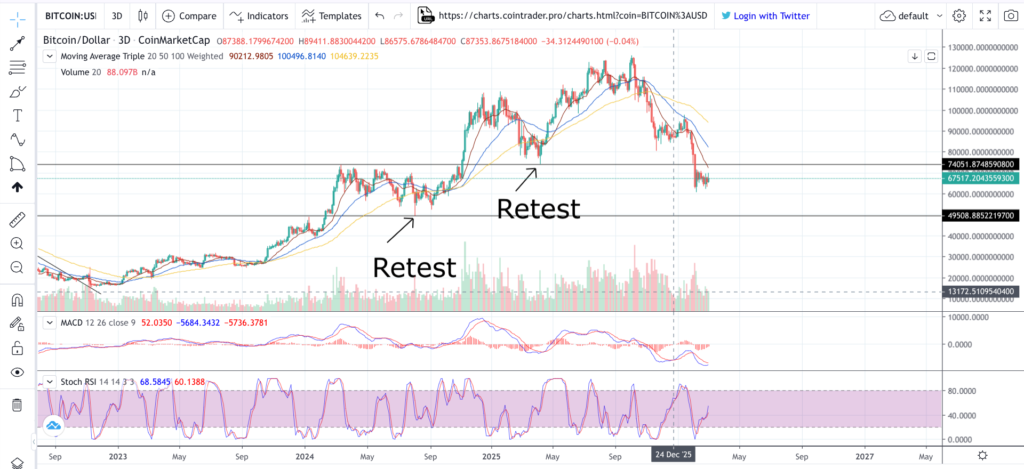
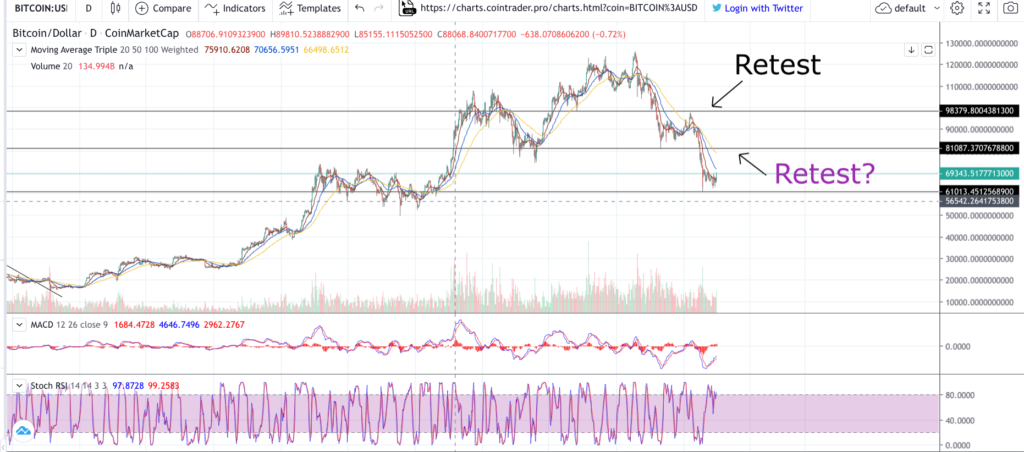
In a downtrend, the more likely scenario is continuation — making lower highs and lower lows. A liquidity sweep back into the previous range is possible, but for this to mark a true bottom, Bitcoin would need to reclaim $98,000 with strong spot-driven demand. At the moment, that remains the lower-probability scenario. Structure has not yet confirmed a reversal.
Where is the bottom?
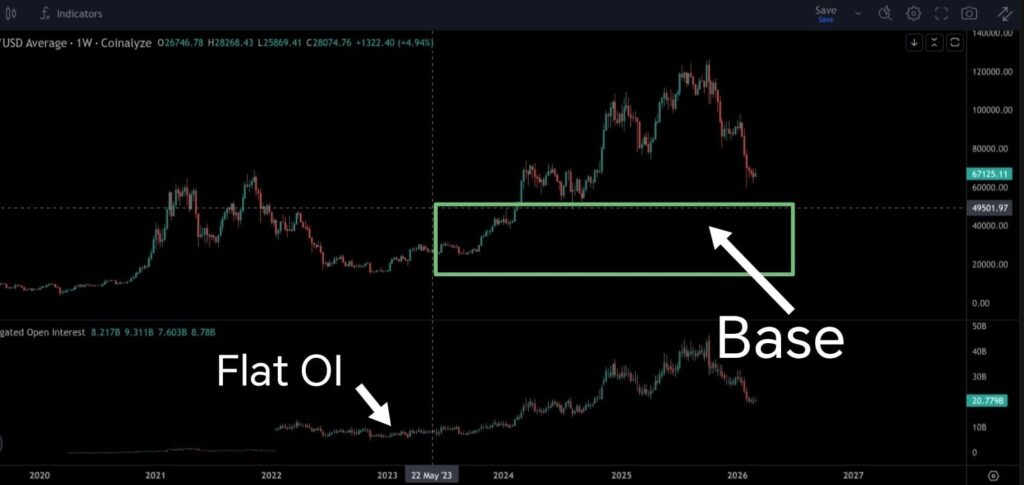
If $60,000 does not hold, we can look at prior accumulation zones to identify potential demand areas. Between 2022 and 2023, Bitcoin formed a large base between $15,000 and $48,000.
During that period, open interest remained relatively flat while price consolidated. This suggests spot-driven accumulation rather than leverage expansion — a healthier base formation. The base for the move toward $126,000 was built in that accumulation zone. If price revisits that area, structural demand is likely to reappear.
Confluence is power
Confluence increases probability. The more independent factors that align at a specific level, the stronger that level tends to become.
Fibonacci extensions, prior range lows, volume clusters, and open interest positioning all create layers of structural support or resistance.
Markets react where liquidity pools exist — not where opinions exist.
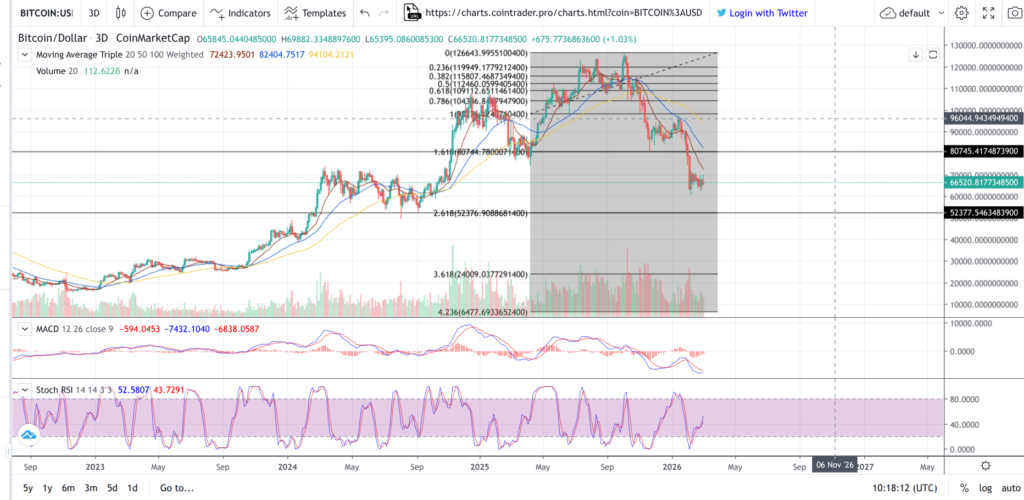
The next major extension sits near $52,000 — notably just above the prior accumulation zone. This creates technical confluence in that region. In longer-term trends, structural breaks matter more than precise levels. The broader trendline remains intact for now. A confirmed break, especially with declining open interest, would signal a structural reset and potentially a strong long-term opportunity.
The most likely scenario?
Based on current structure, the short-term bias remains bearish. Patience is required.
If Bitcoin moves into the $50,000–$60,000 region with signs of leverage unwinding and decreasing open interest, that would present an attractive long-term risk-reward zone. Alternatively, if price reclaims $98,000 with strong spot participation, the bearish structure would be invalidated and the bias would shift.
This is not investment advice — only my interpretation of the current data and market structure.
-MastertheEdge