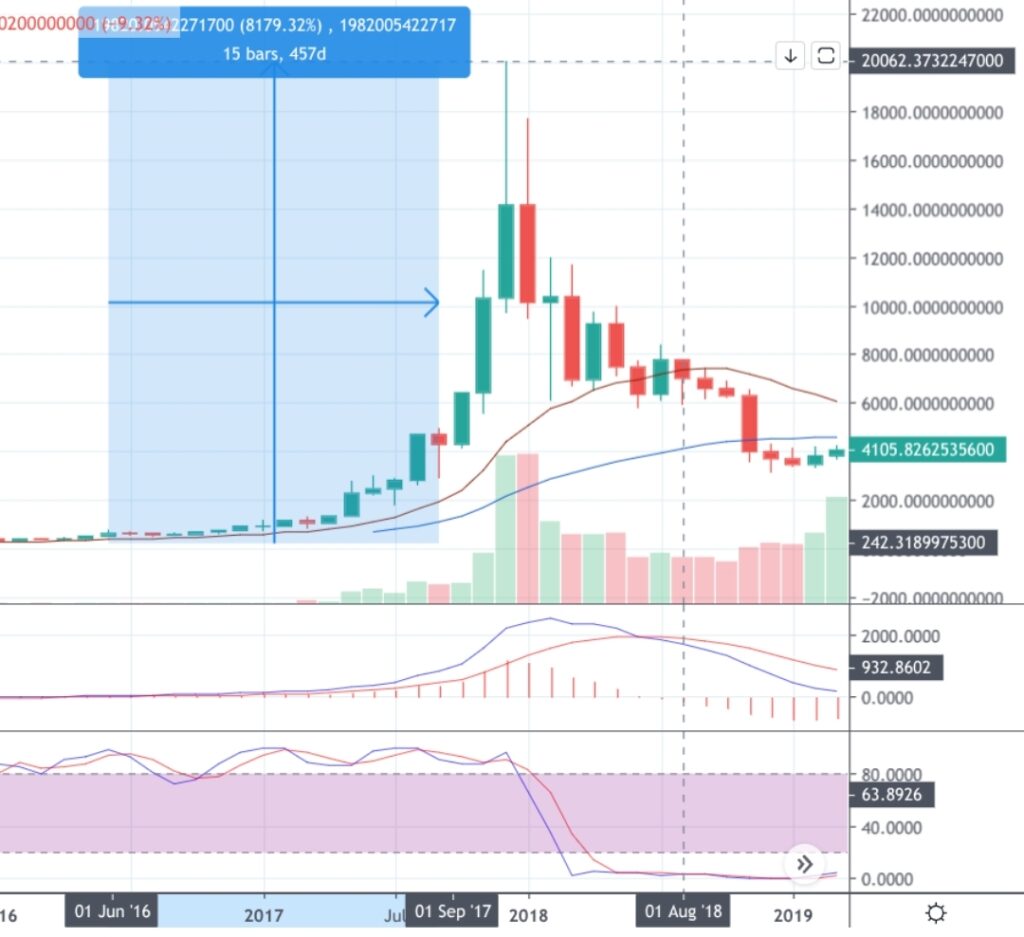
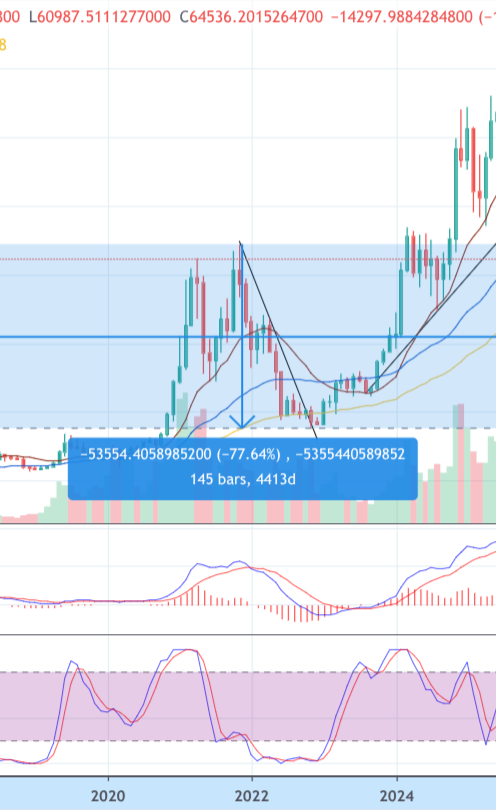
To understand Bitcoin’s volatility it makes sense to view the cycles it has had in the past. In April 2015, Bitcoin traded below $250. By the end of 2017, it had roughly an 8000% gain from the bear market lows. During 2018 Bitcoin dropped 84% down to slightly above $3,000.
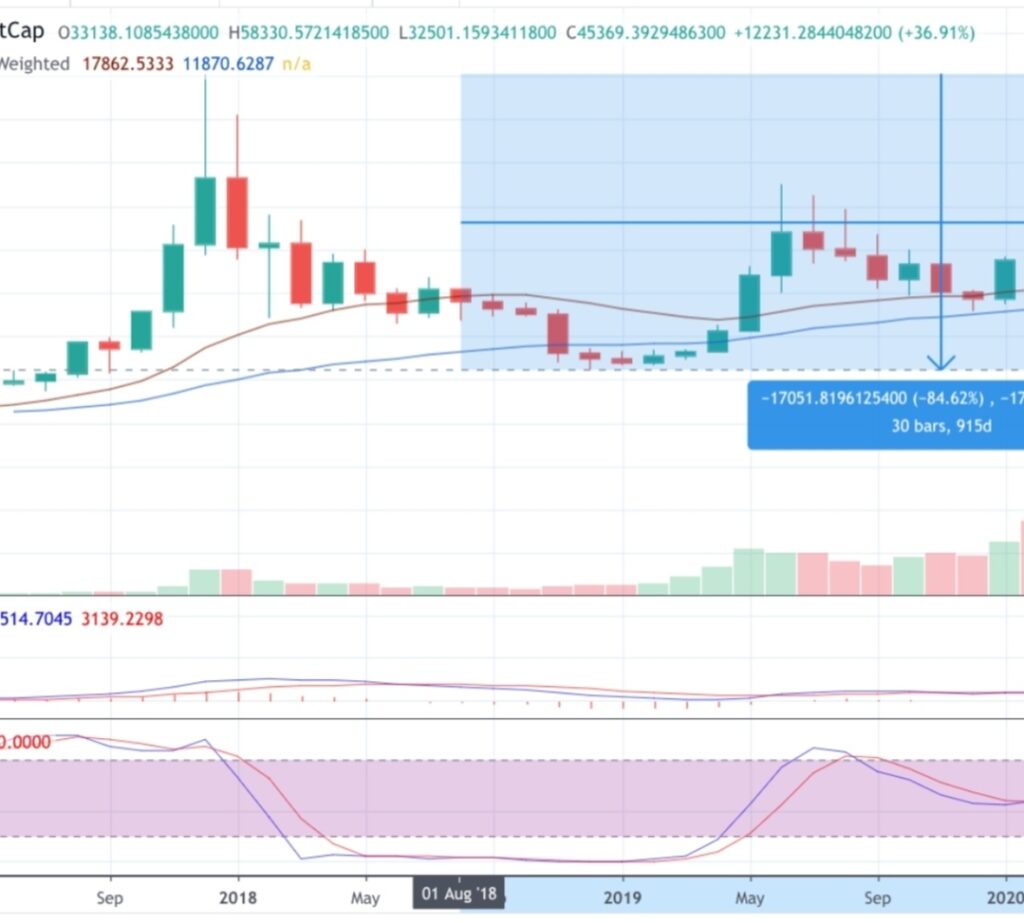
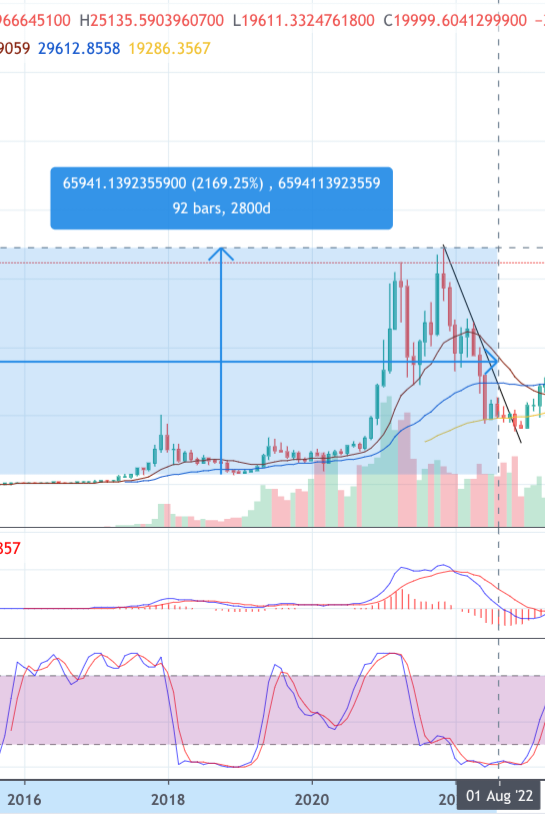
From the 2018 lows to the 2021 peak near $69,000, Bitcoin rose around 2000%. The next bear market saw a drawdown of roughly 78% into late 2022. From the 2022 lows to the peak 2025 near $126,000, the move has been closer to 700%. The liquidity in 2021 came from aggressive QE and the move from 2023 to 2025 was during QT so those moves have had a bit different environment but the logic stays the same for Bitcoin. Unfortunately altcoins have suffered more of the tight monetary policy until now.
The pattern is clear. The percentage gains and losses are still large, but they are smaller in earlier cycles. As market capitalization grows, it simply takes more capital to move the price by same percentage. That alone begins to reduce the magnitude of extreme moves. This does not automatically mean that short-term volatility disappears. It does however suggest that the scale of speculative expansion and contraction is moderating as the asset matures.
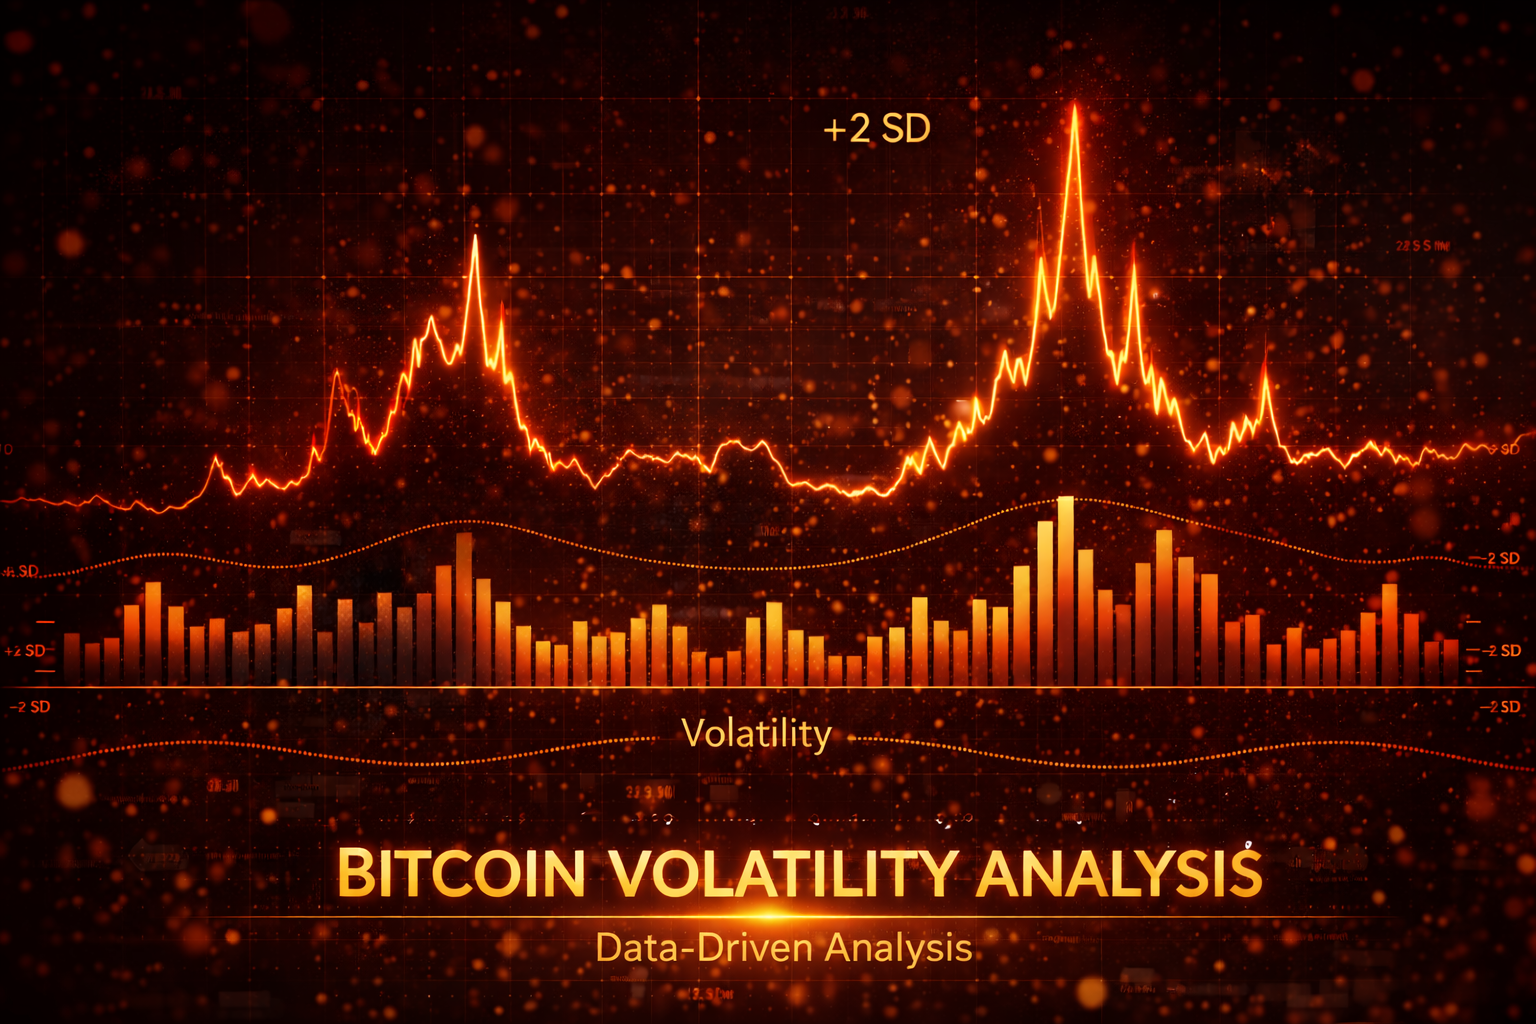
Measuring volatility: 30-Day rolling volatility
If we take a closer look to see whether short-term volatility has changed, we can look at 30-day rolling volatility. Rolling 30-day volatility measures how much price has fluctuated over the most recent 30 days. This is a good indicator to measure short-term price variability. In earlier cycles, especially between 2017 and 2020, 30-day annualized volatility has exceeded 100-150%. In recent years it has more commonly ranged between 40-80%, with fewer extreme spikes.
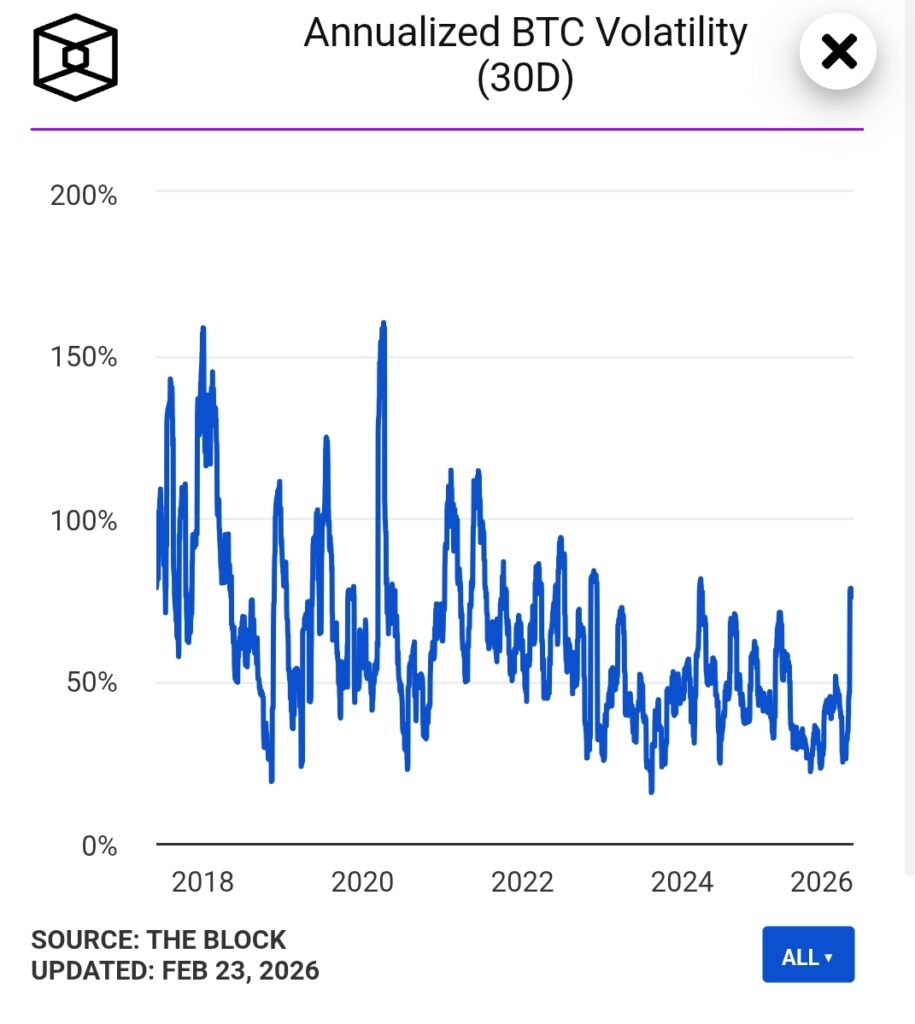
Bitcoin is still volatile compared to traditional indices. But the trend suggests that as liquidity deepens and market structure strengthens, volatility gradually compresses.
Are investors compensated for the volatility?
Volatility alone does not determine investment quality. The more relevant question is whether investors were compensated for taking that risk. You don’t want to own an asset that has only slightly better return than S&P 500 but the 30-day rolling volatility is off the charts. I personally use Sharpe and Sortino indicators for that and those are useful ways to evaluate the risk-adjusted performance.
The Sharpe ratio measures how much excess return an asset generates per unit of total volatility. In simple terms, it tells us how efficiently returns are produced relative to overall price fluctuations. It is calculated by dividing excess return by the standard deviation of returns. A higher Sharpe ratio indicates better risk-adjusted performance. Despite its higher volatility, Bitcoin has historically delivered competitive – and at times superior Sharpe ratios compared to major U.S. equity indices such as the S&P500. Late 2025 Bitcoin’s 12-month annualised Sharpe ratio was around 1.7 compared to the S&P 500 historical Sharpe ratio of about 0.5. It shows strong risk-adjusted performance relative to traditional markets.
Sortino Ratio
While the Sharpe ratio treats all volatility equally, investors typically care more about downside risk than upside moves. The Sortino ratio adjusts for this by measuring return relative to downside deviation only. For an asset like Bitcoin, the Sortino ratio can provide a more nuanced view of risk.
Over extended time horizons, Bitcoin’s Sortino ratio has also compared favorably with major U.S. equity indices. As of late 2025, Bitcoins annualized Sortino ratio reached 3.2, significantly surpassing the S&P 500’s historical average Sharpe of about 0.54. Calculations are based on daily price data (BTC-USD and S&P500), sourced from Yahoo Finance.
The role of liquidity
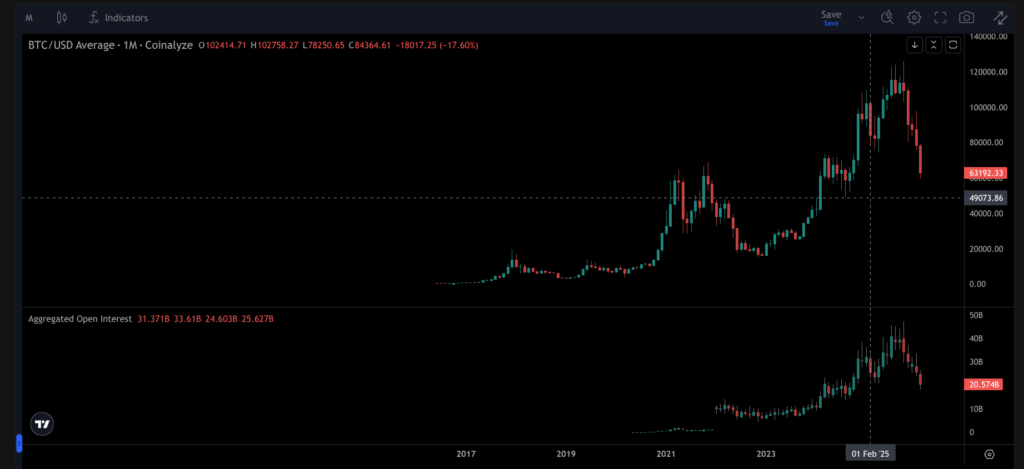
Liquidity and leverage play a central role in how volatility manifests in practice. Liquidity is largely influenced by central bank policy. When central banks expand their balance sheets through quantitative easing (QE), reserves increase in the financial system. Excess liquidity does not stay in cash – it seeks return. A portion of that capital flows, for example, into equities and increasingly digital assets. Conversely, during QT, central bank balance sheets contract and financial conditions tighten. Liquidity is withdrawn from the system and capital becomes more selective. In such environments, speculative excess tends to compress and volatility often increases on the downside. The rise of Bitcoin into new highs between 2023-2025 reflects strong fundamentals. However, macro liquidity is only part of the equation.
Market-specific liquidity also matters. Bitcoin’s liquidity comes from exchange participation, ETF inflows, institutional allocation, derivatives markets and stablecoin issuance. As more capital allocators enter the market and demand grows, liquidity increases rapidly. In simple terms, macro liquidity determines how much capital is available. The strength of the market determines how efficiently that capital is absorbed.
Leverage and market cap
As Bitcoin’s market capitalization grows, so does the amount of leverage operating within the system. Larger markets attract more capital, but they also attract more derivatives activity, margin trading and speculative positioning.
Leverage amplifies both upside and downside moves causing more volatility. During bull markets, rising prices encourage participants to increase exposure. Open interest grows and funding rates rise. Price appreciation fuels additional leverage, which in turn pushes prices higher.
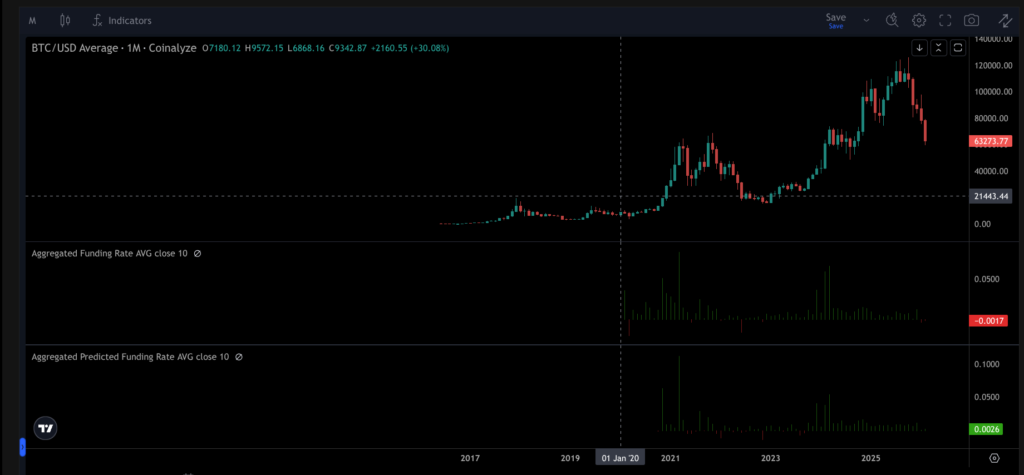
However, leverage does not disappear quietly. When positioning becomes excessive, even a moderate price reversal can trigger forced liquidations. These liquidations accelerate price movements and create volatility spikes. The same mechanism that accelerates the upside also amplifies the downside.
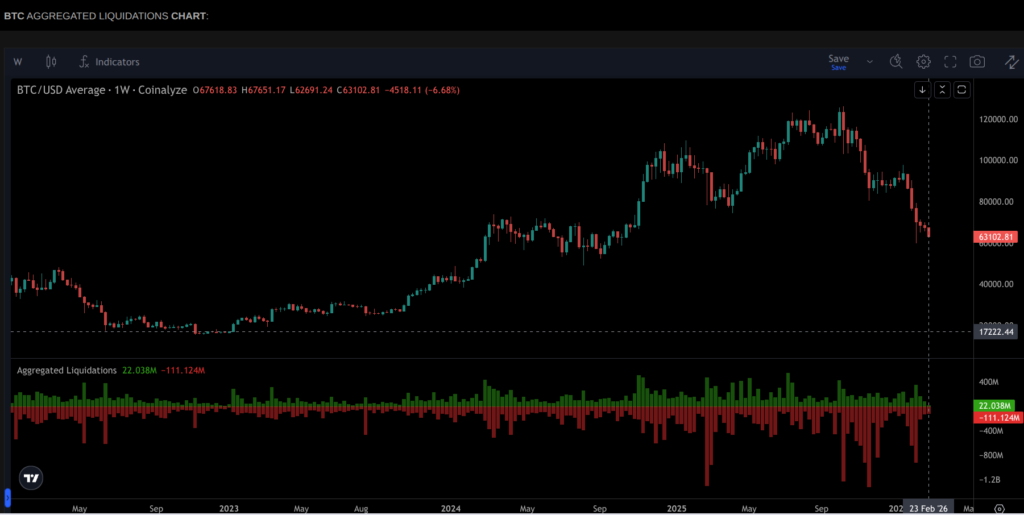
A healthy market periodically resets this excess. Deleveraging events – cycle tops and panic bottoms – remove weak positioning and restore structural balance. This process is not fun but it is necessary. It is one of the core reasons why Bitcoin’s volatility tends to cluster around major turning points.
Bitcoin remains a volatile asset and that’s not going to change in the near future. What is important is to understand the data and dynamics behind the rollercoaster ride. Time is on your side in the market, and the fundamentals of Bitcoin combined with the structure of the global economy, give long-term participants a structural edge.
-MastertheEdge