
Oil moved violently over the weekend. Prices surged from around $90 to briefly touch $115 during the Sunday–Monday session, before falling back below $80 by Monday evening. With tensions in the Middle East dominating headlines, many investors assume that oil and geopolitics will now determine the direction of markets in the coming weeks and months. But the situation is more nuanced than the headlines suggest.
Unlike stocks, oil does not have a single price. The market trades different futures contracts for different delivery months — April 2026, June 2026, October 2026 and so on.The contract closest to delivery surged above $100 during the spike. But when you look further out on the futures curve, the story changes. Oil futures for delivery in 2027 are still trading around the high-$60 range. In other words, the market is not pricing permanently expensive oil.
What it is pricing is a short-term disruption risk. This is the core logic of commodity markets. When geopolitical tensions threaten supply in the near term, the contracts closest to delivery move the most because buyers are willing to pay a premium for immediate availability. Further out on the curve, prices reflect a different assumption: that the situation eventually stabilizes.
Looking beyond oil: liquidity matters more
I have been talking about the liquidity conditions and macro indicators in my recent articles and market updates. Instead of focusing only on oil prices, it is often more useful to look at broader macro indicators that influence liquidity in the financial system. Two important indicators that help track liquidity conditions are the Treasury General Account (TGA) and bank reserves held at the Federal Reserve.
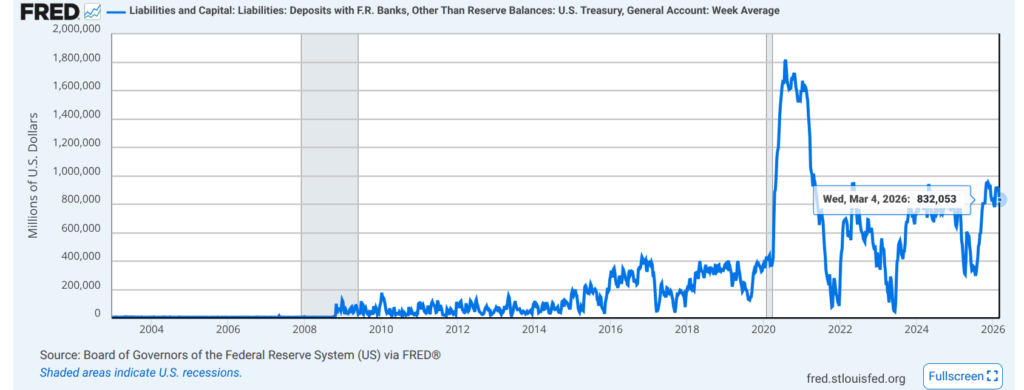
Treasury General Account (TGA)
The Treasury General Account is essentially the U.S. government’s checking account held at the Federal Reserve. When the U.S. Treasury collects taxes or issues new debt, money flows into this account and liquidity is temporarily removed from the broader financial system.
When the Treasury spends money from this account — for example through government spending or payments — that liquidity flows back into the economy and financial markets. Because of this, large changes in the TGA balance can have noticeable short-term effects on market liquidity.
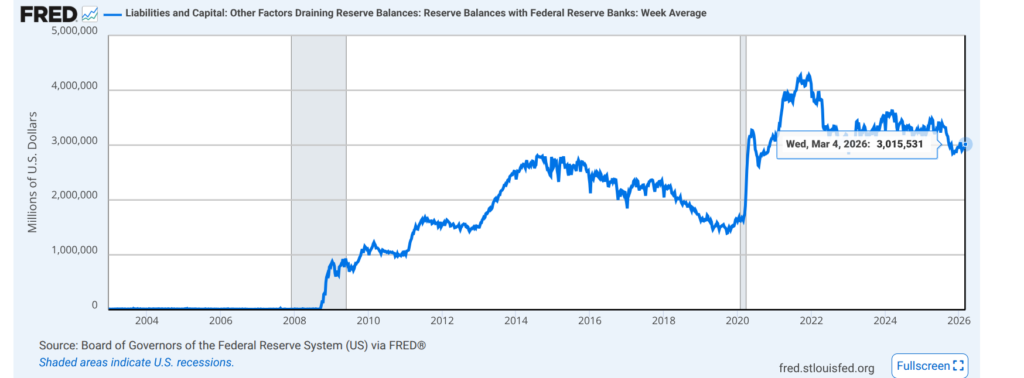
Bank reserves at the Federal Reserve
Bank reserves represent the amount of cash commercial banks hold at the Federal Reserve. These reserves form a core part of the financial system’s liquidity. During QE cycles, reserves typically rise because the Federal Reserve injects liquidity into the banking system. During QT, reserves gradually decline as liquidity is drained.
Currently, bank reserves are near the lowest levels seen during this tightening cycle, while the TGA balance remains relatively elevated. Historically, when reserves approach lower levels and the Treasury begins spending from the TGA, liquidity conditions can start to improve. When liquidity starts to return to the system, risk assets such as equities and cryptocurrencies often benefit.
These indicators therefore provide a useful way to monitor when liquidity conditions might begin to shift again.
Where is Bitcoin heading next?
Bitcoin continues to trade in a sideways range between roughly $60k and $80k, where it has been consolidating for over a month. Structurally, nothing significant has changed since last week’s update. For now, the most probable scenario still remains that Bitcoin could move lower and test the $50k–$60k region before a more sustainable trend reversal takes place. There are currently two strong supply zones above the current price. These areas previously acted as heavy selling pressure, which often leads to corrections when price revisits them.
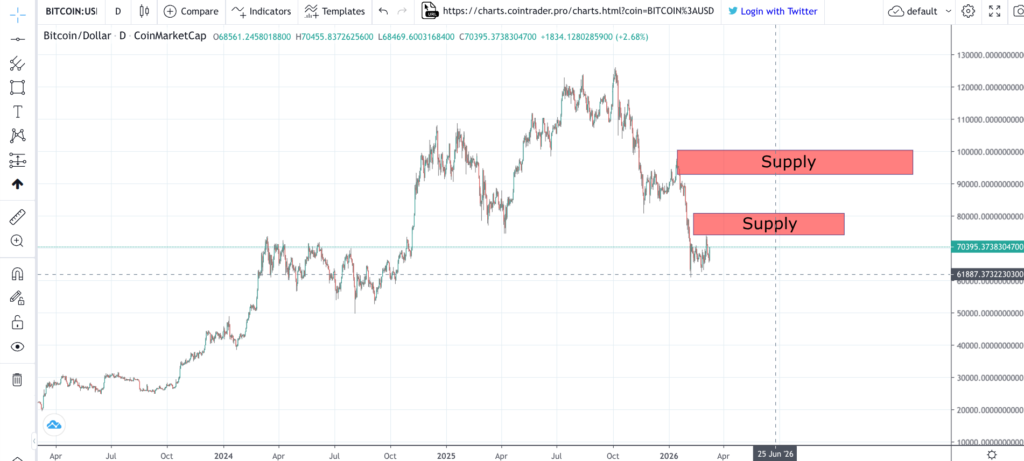
If the recent $60k low already marked the bottom, we would typically expect to see stronger bullish price behavior from here. That would likely involve Bitcoin reclaiming the $80k region and eventually pushing toward the $98k area, which was the level where the impulsive sell-off began earlier this year. Without that type of strength, the current price action still looks more like consolidation within a broader correction.
Huge demand zone for Bitcoin and an indicator which reveals accumulation has started
As I discussed in the previous market update, there is a very strong demand zone below $50 0000. Bitcoin’s open interest remained almost flat during the move from the bear market lows all the way up to $50k. This suggests that the move was largely driven by spot demand rather than excessive leverage. That usually creates a much stronger support zone because the demand is based on actual buying rather than leveraged speculation.
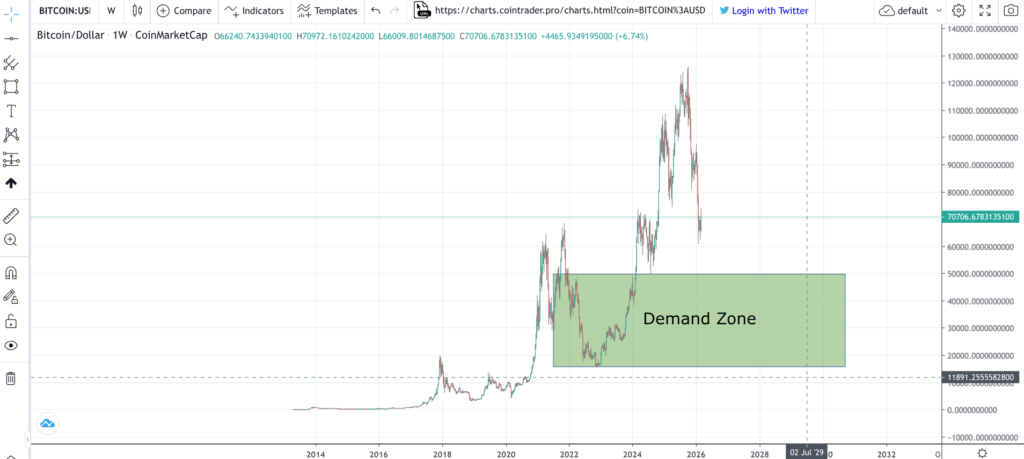
I don’t see many reasons why Bitcoin would move deeply into that area. These large drops in price are usually caused by leverage resets, where over-leveraged traders are forced out of their positions. Profit taking by large investors can trigger these events, but shorting the price deep into a strong demand zone becomes increasingly difficult and expensive. The more spot demand there is, the harder it becomes to push the price significantly lower.
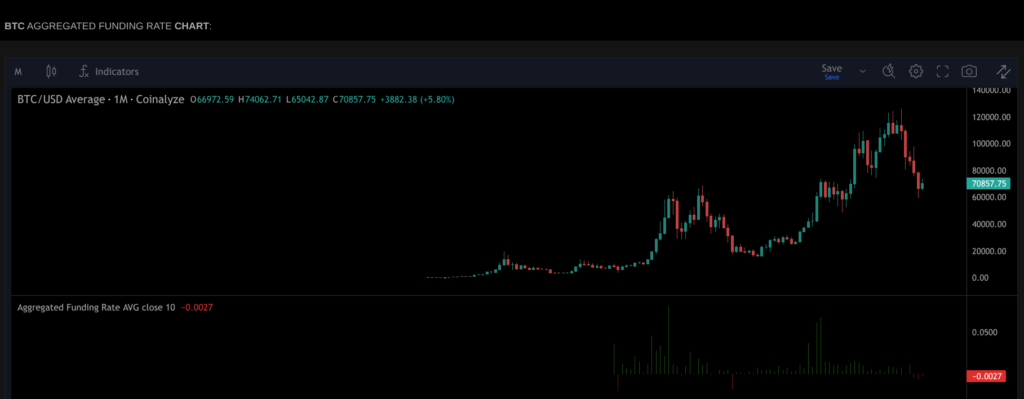
Funding rates on the monthly timeframe have been negative for many consecutive months. Historically, this type of environment has often been a period when long-term accumulation takes place.
However, markets often need one final flush of leverage before a durable bottom forms. At major bull market tops, funding tends to stay extremely positive for long periods of time. During bear market phases, funding can remain negative for months while the market slowly builds a base.
The most likely scenario?
The most likely scenario is that Bitcoin continues moving sideways in the current range until we see a test of $60k, or possibly a temporary break below it to search for the final bottom. In that situation, the best approach is usually patience. The $50k–$60k region remains a very attractive area for long-term Bitcoin accumulation.
If Bitcoin begins to build stronger bullish price behavior, it would not be surprising to see the market revisit the current range again before moving higher. These retests often provide some of the best entry opportunities during larger market transitions.
For now, the most important thing is not trying to predict the exact next move, but reacting to what the market shows.
This is not investment advice – only my interpretation of the current data and market structure.
-MastertheEdge